

Google Analytics is a powerful piece of software that is offered by Google for free. Once installed on your site, it provides valuable visitor data for your organization. This data can then be used to help optimize your site for the best possible experience for your guests.
One aspect, or section, that is important to follow from your Google Analytics report is the content overview. This report details which pages on your website your visitors are viewing the most. Additionally, it allows you to further look at detailed visit information for each page, including measurers like length of stay and exit rates.
Below is a quick synopsis of how to get to and view the report.
Logging in to Google Analytics
Login by going to http://www.google.com/analytics/ and pressing the “Sign In” at the top right corner of the screen.
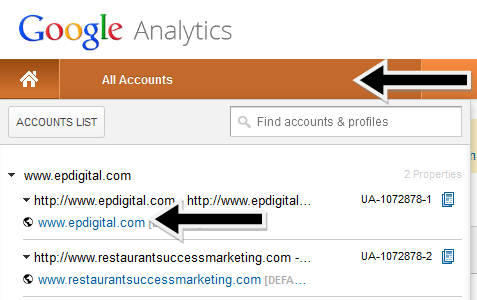
Analytics is designed so that one account can actually track more than one domain. So you will need to navigate to your domain. Once logged in, you will want to navigate to All Accounts > Your Domain Name.
The Content Overview Page
The default landing page after you log in to Analytics will be Audience overview. This report is useful as well, providing you with details on how the number of visitors that your website has had overall. However, the purpose of this post is to get an understanding of the content overview page.
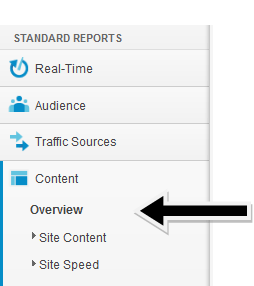
You can navigate to the content statistics by going to Content > Overview in the menu on the left side of the page.
Below I’ve noted some of the more useful parts of this stats page, along with more information following the image.
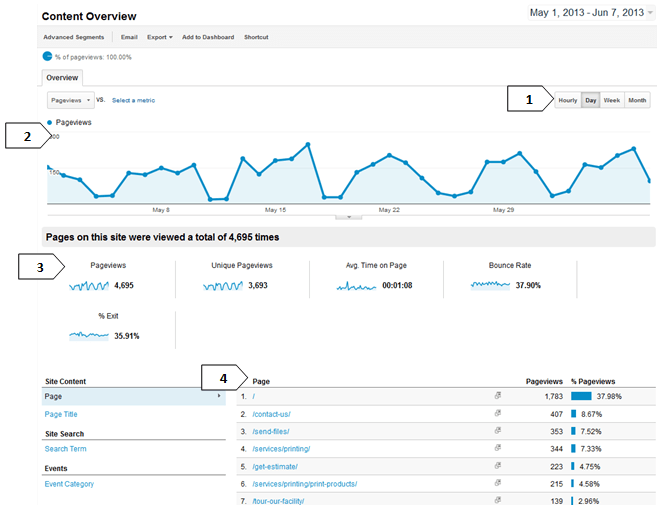
1 – Date Selection – Here you can toggle through which dates you would like to have data for. You can select which time periods are displayed, which is great for trying to make comparisons or analyzing the effect of an event or promotion.
2 – Pageview Graph – This graph makes a visual representation of the data for the time period you had selected. The default data points call from “Pageviews”, or the raw number of page views your site received. You can toggle which criteria is displayed by changing it in the drop down box.
3 – Visitor Statistics – These numbers give you a broad overview of the visitor statics for the date range you had selected. Below is more detail on each item:
- Pageviews – This is the raw number of page views on your site. This includes every time a visitor entered a new page .
- Unique Pageviews – This is the number pageviews your site had in the time frame, but only counting one pageview per visitor, per page.
- Average Time on a Page – This, as the name implies, is the average duration that one of your visitors spends on a page.
- Bounce Rate – The bounce rate is the percentage of visitors that leave your site after going to the homepage. This is another one of those ratios that can tell you how quality your content is and how easy it is to navigate your site. The lower the number, the more interested your visitors.
- % Exit – This is the percent of visitors who exit your site at that point. This is usually from them clicking a link leading to an external website.
4 – Top Pages – This table displays the top viewed pages for the time period you have selected. This is a good indicator as to which pages should be most accessible to your visitors through navigation, as this is the content they are seeking. Clicking on page will give you more detailed information about that page.
How to Utilize this Data
Now that you know which pages your visitors are going to the most, it’s a good idea to look at how your site functions around those pages. Does your site have easy navigation to those pages? Once on a popular page, is there an incentive for your visitor to continue to stay on your site after they are done viewing that content?
You can also look at WHO is visiting those pages, and how they are interacting with them. By breaking your website visitors in to segments, you can see how certain particular groups are interacting with your website.
Many website administrators don’t actively change their websites to better adapt to their popular content. In doing so, you provide your visitors with a better experience, increasing the likelihood of future visits.