
There are 100+ pages in Google Analytics alone. While the amount of website data this tool provides is exciting, it can also be overwhelming for new users. Have no fear! You can still benefit from Google Analytics without being an expert. Below you will find key reports, definitions, and tips to help get you started and on the way to becoming an analytic pro!
Key Data Reports
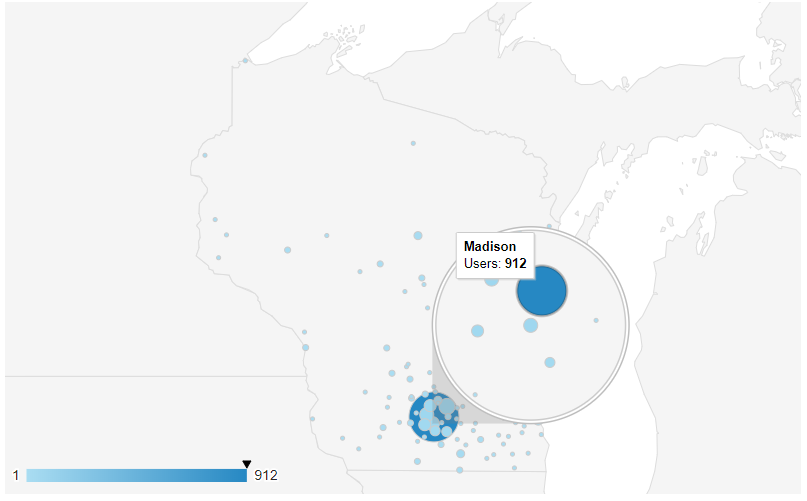
Location
Knowing where your website traffic is coming from geographically will help you determine if:
1) Your website is reaching potential customers.
2) You need to better focus marketing efforts within certain regions.
Once you click into this section (Audience > Geo > Location), you’ll see a world map with shading to signify the concentration of visitors. You can then click on the map to view certain regions in more detail. Under the map, you will also find the data in table format.
Acquisition Overview
This section will display data on the sources that led users to your website. Understanding the top performing channels will help determine what areas could be improved upon or where efforts are best focused. The initial page (Acquisition > Overview) will show a breakdown of:
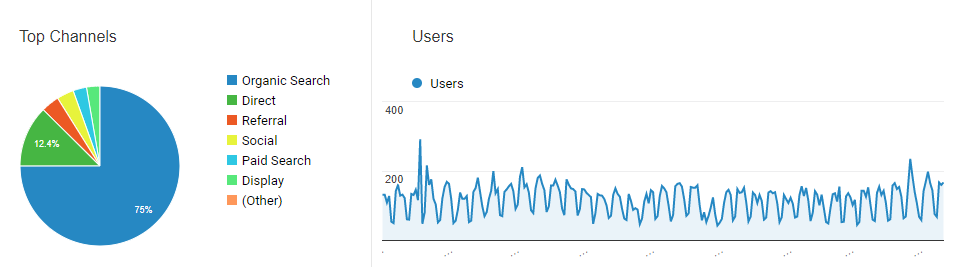
Organic Search: When your website appears as an organic (not paid) result on search engines like Google and is clicked by the user.
Direct: When users already have a direct link to your website and either type it directly into their address bar or use a browser bookmark.
Paid Search: When traffic is driven to your website via paid advertising, featured on relevant search result pages.
Display: When retargeting campaigns direct traffic to your webstite. These “Display” ads are typically created via tools like Google AdWords.
Social: When traffic is generated via social networks like Facebook, LinkedIn, or Twitter.
Referral: When users click a link to your website from another website.
Behavior Overview
If you’re looking for a quick summary of website activity then the Behavior Overview page is for you (Behavior > Overview)! There are several key metrics provided in this section that will help you determine the number of users on your website and their level of engagement over the course of a set period.
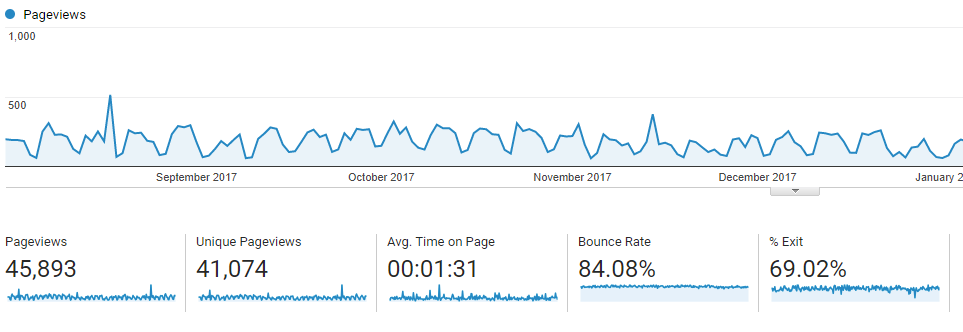 Pageviews: Total number of pages viewed, regardless of the number of users.
Unique Pageviews: Based on the number of unique visitors that viewed a page at least once. If a user goes back to the same page multiple times, only the first view is counted.
Average Time on Page: Google Analytics takes an average of the amount of time spent viewing a page. Under the Behavior Overview, this number is really an average for all pageviews.
Bounce Rate: A “bounce” is a session on your website that only triggers one Analytic request. That means the user came to your site and left without interacting with any other pages/elements. The bounce rate is simply the number of single-page sessions divided by all sessions.
Site Content
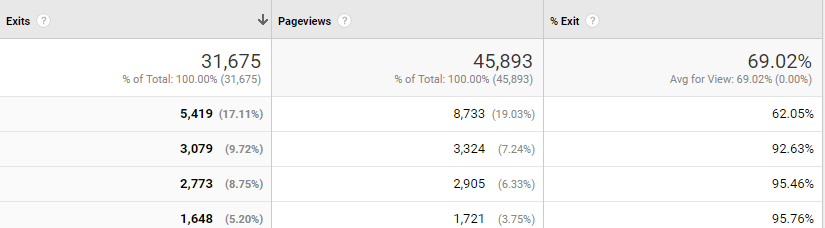
While the overview page discussed above contains a table with individual page data, it only shows the top 10 viewed pages. The All Pages view (Behavior > Site content > All Pages) will show you every single page on your website along with some extra data, Entrances and % Exit. This will help you determine if your priority content is being viewed, what pages are performing well, and where you should focus on driving more traffic.
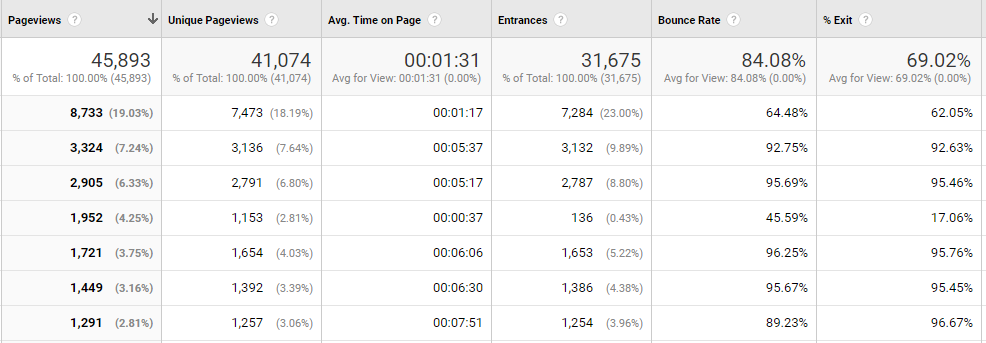
Entrance: This shows the number of times a specific page was the landing page for (entrance to) your website.
% Exit: The number of exits from your website divided by the total number of pageviews. In most cases the lower this percentage the better.
Exit Pages
This is where you will find a list of the pages users exit from (Behavior> Site Content > Exit Pages). As we know, all good things must come to an end, so it is only natural that your website will have exit pages. However, knowing which pages are viewed last may help you determine if users are leaving before or after taking important actions.
Quick Tips
Compare dates
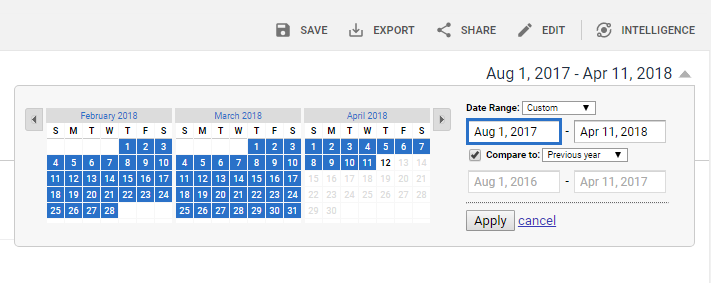
Basically, all data in Google Analytics can be set to a specific date range. However, it can also be very helpful to compare data from two different time periods. You can do just that under the date picker by selecting the “Compare to” checkbox.
Download Reports
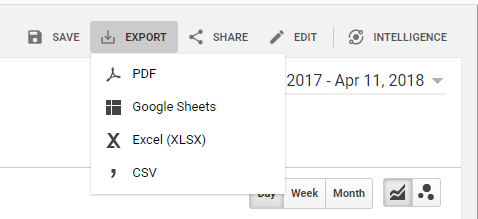
Need to share data during a meeting or just for your records? You can download each report provided by Google Analytics as a PDF, Google Sheet, Excel file, or CSV. To do so, just select the Export option and the file format you’d like from the top of your screen.
Block your own IP Address(s)
Since you probably don’t want to count website traffic from within your organization, you’ll want to block your IP Address. Don’t know what your IP Address is? No problem!
1) Go to Google and type in “What is my IP Address.” Now that you have that information, you can head back over to Google Analytics.
2) Select the Admin section.
3) I highly recommend creating a new View first (tracking for this view will not pull past data).
4) Go to Filters.
5) Click the red Add Filter button.
6) Insert a name, like “Internal IP.”
7) Select Exclude > Traffic from the IP address > that are equal to.
8) Enter your IP address and then save.
If you’re more of a visual person, check out our video walkthrough of creating a new filter:
Google Analytics Summary
There are countless tools and countless metrics when it comes to digital marketing. Google Analytics will offer insight on your website’s traffic relating to the your audience, acquisition methods, user behavior, and conversions. Utilizing the reports and tips discussed above will help you create a solid foundation of analytic knowledge. Once you’re ready to learn more, here are some additional resources:
Google Analytics Academy • Analytics Help Center • Developers’ Guide